
BI
What is it for? This screen is the BI (Business Intelligence) report screen that allows sales data to be analyzed on a monthly basis.
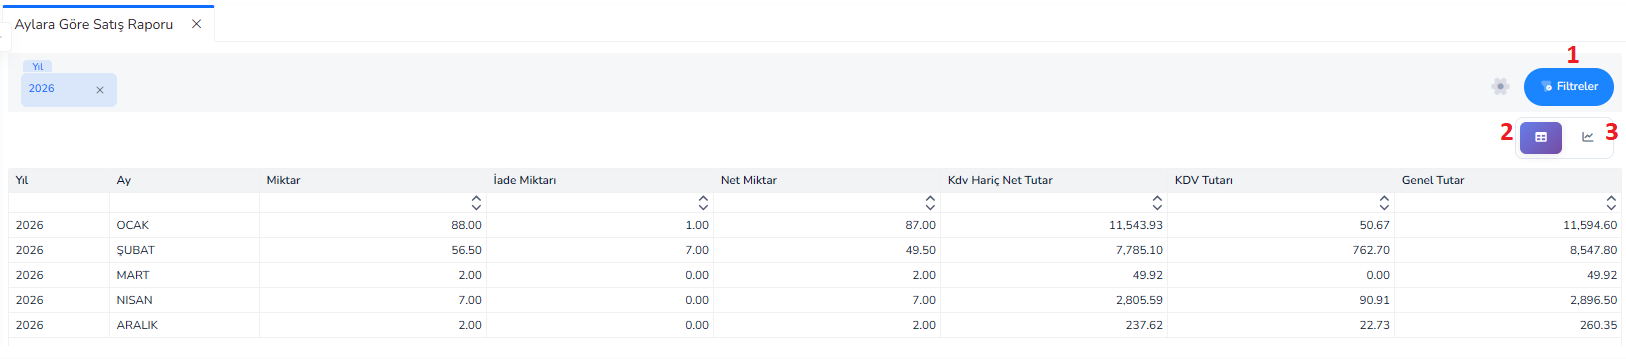
What Does It Do?
This screen is the BI (Business Intelligence) report screen that allows sales data to be analyzed on a monthly basis.
Thanks to this report:
- Monthly sales performance is monitored
- Returns and net sales are analyzed
- Tax and total amounts are compared
- Trend analyzes are made
General Working Logic:
- Year filter is selected
- The system returns sales data for the relevant year
- Data is displayed as a table or graph
- User analyzes monthly performance
Upper Filter Fields:
1.Filters Button: Opens additional filtering options
2.Table View: Lists the data in rows and columns
3.Graphic View: Shows data as visual graphs (bars, lines, etc.)
Tablespace:
- Year: The year the data belongs
- Month: The month in which the sale took place
- Quantity: Total sales amount
- Return Amount: Amount of returned product
- Net Amount:Net amount remaining after sale – return
- Net Amount Excluding VAT: Sales amount excluding tax
- VAT Amount: Calculated value added tax
- General Amount:Total sales amount including VAT
What to Do on This Screen?
- Data is filtered by selecting the year
- Monthly sales data is examined
- Return and net sales are compared
- Trend analysis is performed with a graphic view
- Business performance is evaluated
Important Note
- This screen does not enter data, only provides analysis
- Data comes from sales invoices in ERP
- Graphical view speeds up the decision-making process
This screen is the BI report screen that allows sales data to be analyzed by months and facilitates performance tracking.
REPORTSGeneral Description
Purchasing reports are BI (Business Intelligence) report screens used to analyze the procurement processes of the business. Thanks to these reports, purchasing transactions; It can be examined in detail on the basis of month, supplier and product.
Purchase Report by Month
Enables analysis of purchases on a monthly basis
Intended use:
- Seeing monthly purchasing trends
- Making periodic cost analysis
Supplier Based Procurement Report

What Does It Do?
This screen is the BI report screen that allows the analysis of purchases on a supplier basis.
Thanks to this report:
- You can see how much was purchased from which supplier
- Supplier-based cost analysis is performed
- The most working suppliers are determined
General Working Logic:
- Filtering criteria are determined
- Retrieves system purchase data
- Data is grouped by supplier
- User analyzes supplier performance
Parent Fields:
1.Filters Button: Opens detailed filtering options
2.Table View: Shows the data in a table
3.Graphic View: Shows the data graphically
Table Fields:
- Supply:The company or person from which the purchase is made
- Net Quantity:Net amount of product received after returns and corrections
- Net Amount Excluding VAT: Total purchase amount excluding tax
- General Amount:Total purchase amount including VAT
What to Do on This Screen?
- Suppliers are listed
- Purchase quantities are compared
- Cost analysis is done
- The suppliers from which most purchases are made are determined
- Supplier performance is evaluated
Important Note
- This screen does not enter data
- Data comes from purchase invoices and orders
- It is a critical report for purchasing and cost management
This screen provides cost control and supplier performance management by analyzing purchasing transactions on a supplier basis.
Product Based Purchasing Report

What Does It Do?
This screen is the BI report screen that allows purchasing transactions to be analyzed on a product basis.
Thanks to this report:
- You can see how much of which product is purchased
- Product based cost analysis is performed
- The most purchased products are determined
General Working Logic
Parent Fields:
1.Filters Button: Opens detailed filtering options
2.Table View: Shows the data in a table
3.Graphic View: Shows the data graphically
Tablespace:
- Product: Purchased product name
- Quantity: Total quantity of items purchased
- Return Amount: Amount of returned product
- Net Amount:Net amount remaining after return
- Net Amount Excluding VAT: Total purchase amount excluding tax
- VAT Amount: Tax amount for purchases
- General Amount:Total purchase amount including VAT
What to Do on This Screen?
- Product based purchase data is examined
- The most purchased products are determined
- Return rates are analyzed
- Cost control is carried out
- Inventory planning supported
Important Note
- This screen does not enter data
- Data comes from purchase invoices and orders
- It is a critical report for stock and purchasing management
This screen contributes to cost control and stock planning by analyzing purchasing transactions on a product basis.
ORDER MANAGEMENT-REPORTSOrder Report by Month

What Does It Do?
This screen is the BI report screen that allows the orders created within the scope of order management to be analyzed on a monthly basis.
Thanks to this report:
- Monthly order density is visible
- Order quantities are analyzed
- Periodical demand changes are followed
- Operational planning is done
General Working Logic:
- Date and order type are selected
- The system returns the relevant order data
- Data is displayed as a table or graph
- Analyzes user monthly order trends
Top Filter:
1.Filters Button: Opens additional filtering options
2.Table View: Shows the data in a table
3.Graphic View: Shows the data graphically
Tablespace:
- Year: The year the data belongs
- Month: The month the order was placed
- Quantity:Total order quantity
- Net Amount Excluding VAT: Order amount excluding tax
- General Amount:Total order amount including VAT
What to Do on This Screen?
- Year and order type are selected
- Monthly order data is examined
- Order density is analyzed
- Trend can be followed with a graphic view
- Business planning and procurement processes are optimized
Important Note
- This screen does not enter data
- Data comes from the order module
- Provides critical analysis for sales and purchasing planning
This screen is the BI report screen that supports demand and operation planning by enabling analysis of order data by months.
Sales Orders Report

What Does It Do?
This screen is the BI report screen that allows status-based analysis of created sales orders.
Thanks to this report:
- The shipment status of the orders is tracked
- Pending and completed orders are visible
- Order-based financial analysis is performed
- Operational processes are controlled
General Working Logic:
- Order status filter is selected
- The system fetches order data
- Data is displayed as a table or graph
- Analyzes user order processes
Upper Filter Area:
1.Filters Button: Opens additional filtering options
2.Table View: Shows the data in a table
3.Graphic View: Shows the data graphically
Tablespace:
- Document: Order document number
- Current: The customer to whom the order belongs
- Order Date: Date the order was created
- Deadline Date:Date by which the order must be delivered
- Order Amount:Total amount of the order (excluding / including VAT, depending on the system structure)
- VAT Amount: Tax amount for the order
- Order Quantity: Total quantity of items ordered
- Quantity Shipped:Amount of product delivered
- Pending Quantity: Quantity not yet shipped
- Shipment Amount: Total amount of delivered products
- Pending Amount: Order amount that has not yet been delivered
What to Do on This Screen?
- Order status is filtered
- Shipped and pending orders are analyzed
- Deadline processes are controlled
- Operational delays are detected
- Sales processes are optimized
Important Note:
- This screen does not enter data
- Data comes from sales orders
- Directly related to shipping and billing processes
This screen helps manage shipping and operation processes effectively by enabling status-based analysis of sales orders.
Purchase Orders Report

What is it for?
This screen is the BI report screen that allows analysis of the created purchase orders based on branch and quantity.
Thanks to this report:
- Supply processes are monitored
- Ordered and met quantities are analyzed
- Payment and cost information is tracked
- Branch based purchasing performance is evaluated
General Working Logic:
- Filtering criteria are determined
- The system fetches purchase order data
- Data is displayed as a table or graph
- Analyzes user purchasing processes
Parent Fields:
1.Filters Button: Opens detailed filtering options
2.Table View: Shows the data in a table
3.Graphic View: Shows the data graphically
Table Fields:
- Branch: Branch information to which the order belongs
- Quantity: Total quantity of items ordered
- Payment Amount:Amount of payment made against the order
- Net Amount: Net remaining amount after the transaction
- Amount: Total order amount
- VAT Amount: Tax amount for the order
- Net Amount Excluding VAT: Total amount excluding tax
- VAT Amount: Total tax (may appear as a repeat column in some systems)
- General Amount:Total order amount including VAT
What to Do on This Screen?
- Purchase orders are analyzed
- Branch based performance is compared
- Payment and order relationship is examined
- Purchasing processes are optimized
Important Note
- This screen does not enter data
- Data comes from buy orders
- Directly related to finance and inventory processes
This screen helps manage purchasing processes effectively by analyzing purchase orders based on branch, quantity and amount.
Order Qualification Report

What Does It Do?
This screen is a BI report screen that analyzes the fulfillment status of orders and shows how many of the orders have been completed and how many are insufficient.
Thanks to this report:
- Order fulfillment rate is visible
- Return and net order status is analyzed
- Branch based qualification check is carried out
- Operational deficiencies are identified
General Working Logic:
- Filtering criteria are determined
- The system analyzes order data
- Order, returns and net values are calculated
- Evaluates user proficiency
Parent Fields:
1.Filters Button: Opens detailed filtering options
2.Table View: Shows the data in a table
3.Graphic View: Shows the data graphically
Table Fields
- Branch: The branch to which the orders belong
- Quantity: Total ordered quantity
- Return Amount: Returned order amount
- Net Quantity:Net order amount remaining after return
- Net Amount Excluding VAT: Total order amount excluding tax
- VAT Amount: Tax amount for orders
- General Amount:Total order amount including VAT
What to Do on This Screen?
- The fulfillment status of orders is analyzed
- Return rates are examined
- Net order quantities are evaluated
- Branch based performance is compared
- Missing or inadequate processes are detected
Important Note
- This screen does not enter data
- Data comes from the order module
- Provides critical analysis for planning and inventory management
This screen enables the evaluation of operational efficiency by analyzing the adequacy and fulfillment status of orders.
FINANCE-REPORTSPayment Report Screen

What Does It Do?
This screen is the BI report screen that allows analysis of collection and payment transactions made within the scope of the finance module according to payment type.
Thanks to this report:
- Cash, POS and check collections are monitored separately
- Payment distributions are analyzed
- Financial flow is controlled
General Working Logic:
- Filtering criteria are determined
- The system returns financial data
- Distribution is calculated according to payment types
- User analyzes financial situation
Parent Fields:
1.Filters Button: Opens detailed filtering options
2.Table View: Shows the data in a table
3.Graphic View: Shows the data graphically
Tablespace:
- Cash: Collection/payment amount made in cash
- POS:Collections made via credit card / POS
- Cheque: Collection/payment amount made by check
What to Do on This Screen?
- Distribution is analyzed according to payment types
- Cash flow is controlled
- POS and check rates are examined
- Financial planning is done
Important Note
- This screen does not enter data
- Data comes from cash, bank and collection transactions
- For financial analysis and reporting purposes
This screen supports cash flow and collection management by analyzing the distribution of financial transactions according to payment types.
Collection Status Report

What Does It Do?
This screen is the BI report screen used to analyze the distribution of the collections made by the business according to payment types and the current collection status.
Thanks to this report:
- The method by which collections are made can be seen
- Cash flow is analyzed
- Financial collection performance is evaluated
General Working Logic:
- Filtering criteria are determined
- The system fetches collection data
- Distribution is calculated according to payment types
- Analyzes user collection status
Parent Fields:
1.Filters Button: Opens detailed filtering options
2.Table View: Shows the data in a table
3.Graphic View: Shows the data graphically
Table Fields:
- Cash: Collection amount in cash
- POS:Collections made via credit card / POS
- Cheque: Collection amount made by check
What to Do on This Screen?
- The distribution of collections according to payment type is examined
- Cash and card collection rates are analyzed
- Financial collection performance is evaluated
- Cash flow is controlled
Important Note
- This screen does not enter data
- Data comes from cash, bank and collection transactions
- For financial analysis and reporting purposes
This screen helps evaluate the financial collection performance of the business by analyzing the distribution of collections according to payment types.
Creditors Account Status Report
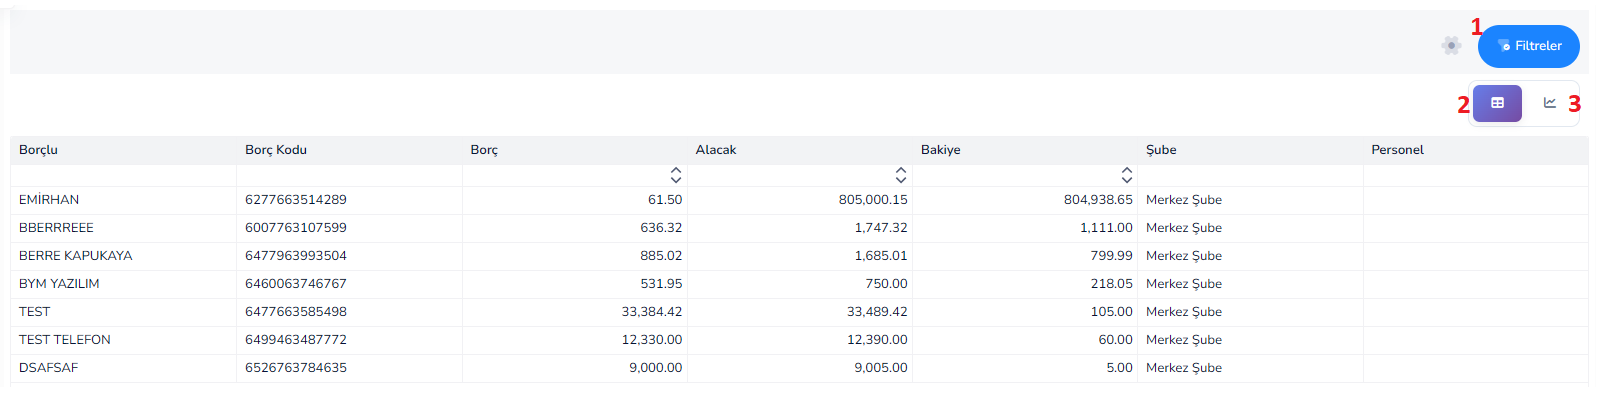
What Does It Do?
This screen is the financial report screen used to collectively view and analyze the receivables, debits and balance statuses of the current accounts (customers/suppliers) on which the business operates.
Thanks to this report:
- You can see how much will be received from whom
- Current account balances are analyzed
- Financial situation is evaluated quickly
General Working Logic
- Filtering criteria are determined
- The system brings current account data
- Debit, credit and balance are calculated
- User analyzes financial situation
Parent Fields:
1.Filters Button: Opens detailed filtering options
2.Table View: Shows the data in a table
3.Graphic View: Shows the data graphically
Table Fields:
- Debtor:Current account name (customer / company)
- Debit Code:System or reference code of the current account
- Debt:The amount of the current account owed to the business
- Receivable:The amount of the current account receivable from the business
- Balance: Difference between debit and credit (net situation)
- Branch: The branch to which the transaction is linked
- Personnel: Personnel information related to the transaction
What to Do on This Screen?
- Current accounts are listed
- Debit and receivable situations are examined
- Net balance analysis is performed
- Risky or high-balance current accounts are identified
- Financial planning is done
Important Note
- This screen does not enter data
- Data comes from current, invoice and payment transactions
- It is a critical report for financial management
This screen helps track the financial balance of the business by analyzing the debit, credit and balance status of current accounts.
Debtors Account Status Report

What Does It Do?
This screen analyzes the debt status of the business on the basis of current accounts. It is the financial report screen used to view.
Thanks to this report:
- It is seen to whom the business owes money
- Current account-based debit and credit balance is analyzed
- Payment planning is done
General Working Logic:
- Filtering criteria are determined
- The system brings current account data
- Debit, credit and balance are calculated
- User analyzes debt situation
Parent Fields:
1.Filters Button: Opens detailed filtering options
2.Table View: Shows the data in a table
3.Graphic View: Shows the data graphically
Table Fields:
- Debtor:Current account name (supplier / company)
- Debtor Code:System or reference code of the current account
- Debt:The amount of the business's debt to the relevant current account
- Receivable:The amount of the current account receivable from the business
- Balance: Difference between debit and credit (net situation)
- Branch: The branch to which the transaction is linked
- Personnel: Personnel information related to the transaction
What to Do on This Screen?
- Current accounts are listed
- Debt situations are examined
- Net balance analysis is performed
- Current clients who need to be paid are determined
- Financial planning is done
Important Note
- This screen does not enter data
- Data comes from current, invoice and payment transactions
- It is a critical report for payment management
This screen enables effective management of financial liabilities by analyzing the debt status of the business to current accounts.
Cheque / Note Status Report

What Does It Do?
This screen is the financial report screen used to track and analyze the status of checks and bills in the business's portfolio.
Thanks to this report:
- Which checks/bills are considered to be due?
- Collected and pending documents are analyzed
- Financial risk and cash planning is done
General Working Logic:
- Filtering criteria are determined
- The system brings check/bill data
- Maturity and status information is listed
- User analyzes financial situation
Parent Fields:
1.Filters Button: Opens detailed filtering options
2.Table View: Shows the data in a table
3.Graphic View: Shows the data graphically
Table Fields:
- Current: The person/company to whom the check or bill belongs
- Amount: Check/note amount
- Maturity Date: The date on which the check or promissory note will be collected
- Issuance Date: The date the document was issued
- Status: Current status of the check/bill
What to Do on This Screen?
- Cheques and bills are listed
- Maturity dates are checked
- Collection status is analyzed
- Risky documents are detected
- Cash planning is done
Important Note
- This screen does not enter data
- Data comes from check/bill transactions
- It is critical for financial risk management
This screen enables effective management of financial risk and collection processes by analyzing the maturity and status information of checks and bills.
STOCK-REPORTSStock Inventory Report

What Does It Do?
This screen is the stock report screen used to view and analyze the inventory information of all stock cards registered in the system.
Thanks to this report:
- Current stock information is listed
- The purchasing and sales information of the products are examined
- Group and category based distribution of stocks can be seen
General Working Logic:
- Filtering criteria are determined
- The system fetches stock card data
- Product information is listed in tabular form
- User analyzes stock status
Parent Fields:
- Filters Button: Opens detailed filtering options
Table Fields:
- Stock Name: The name of the product registered in the system
- Stock Name (short / alternative): Alternative or short name of the product
- Code:Unique code of the stock card
- Barcode: Barcode number of the product
- Purchase Price:Purchase price of the product
- Selling Price: Selling price of the product
- Purchase VAT Rate:VAT rate on the purchase of the product
- Unit: Unit of measurement of the product
- Group: Main category to which the product belongs
- Group 1: Subcategory 1
What to Do on This Screen?
- Stock cards are listed
- Product information is examined
- Price and category analyzes are made
- Stock classification is checked
Important Note
- This screen shows stock card information, not stock quantity
- Data comes from stock card definitions
- Separate stock movement / inventory reports can be used for stock quantities
This screen allows product-based analysis and classification by listing the detailed information of the stock cards in the system.
Bu doküman yardımcı oldu mu?
Eksik veya geliştirilmesi gereken bir bölüm varsa destek ekibimizle paylaşabilirsiniz.