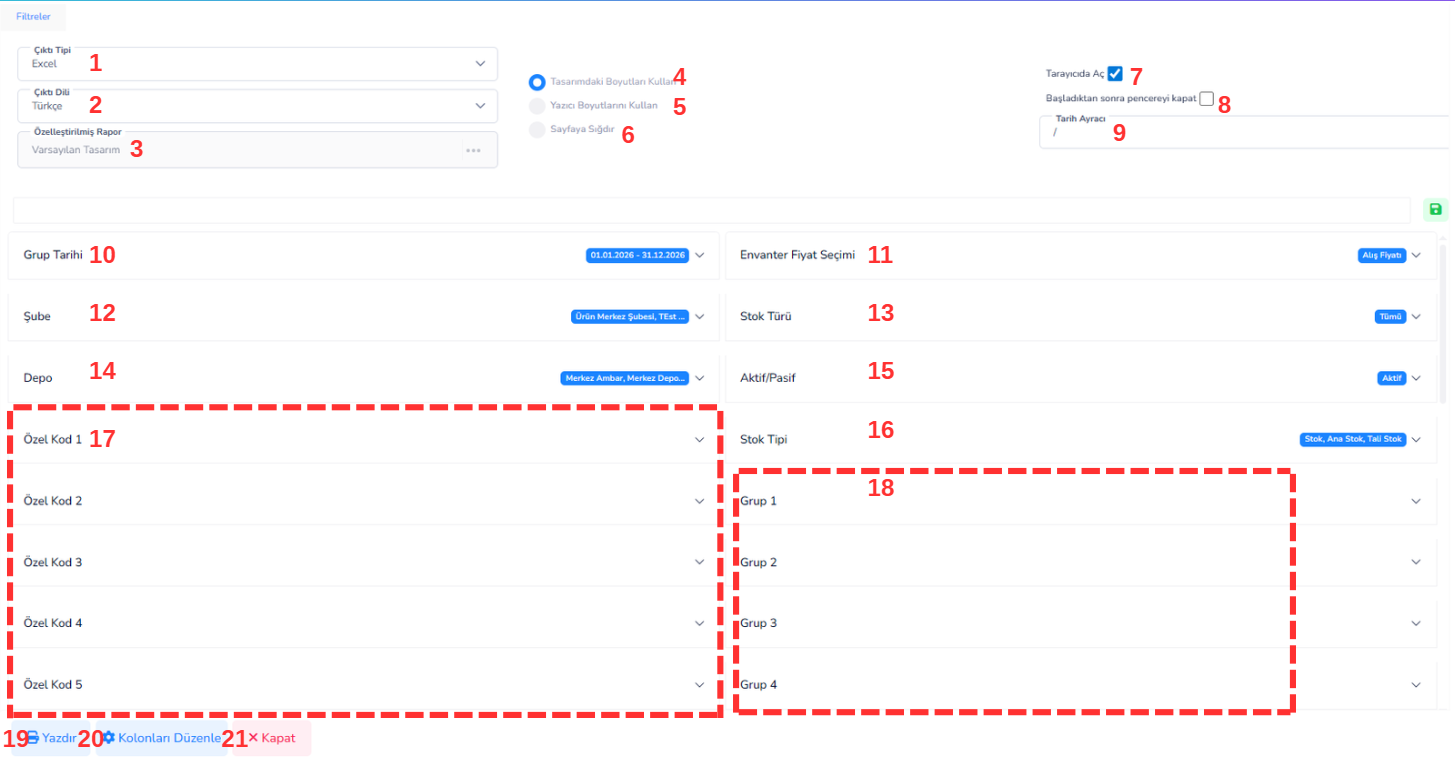
This report is used to analyze the inventory status of stocks within two specified date ranges.
Stock quantities and values are listed in detail according to the selected criteria.
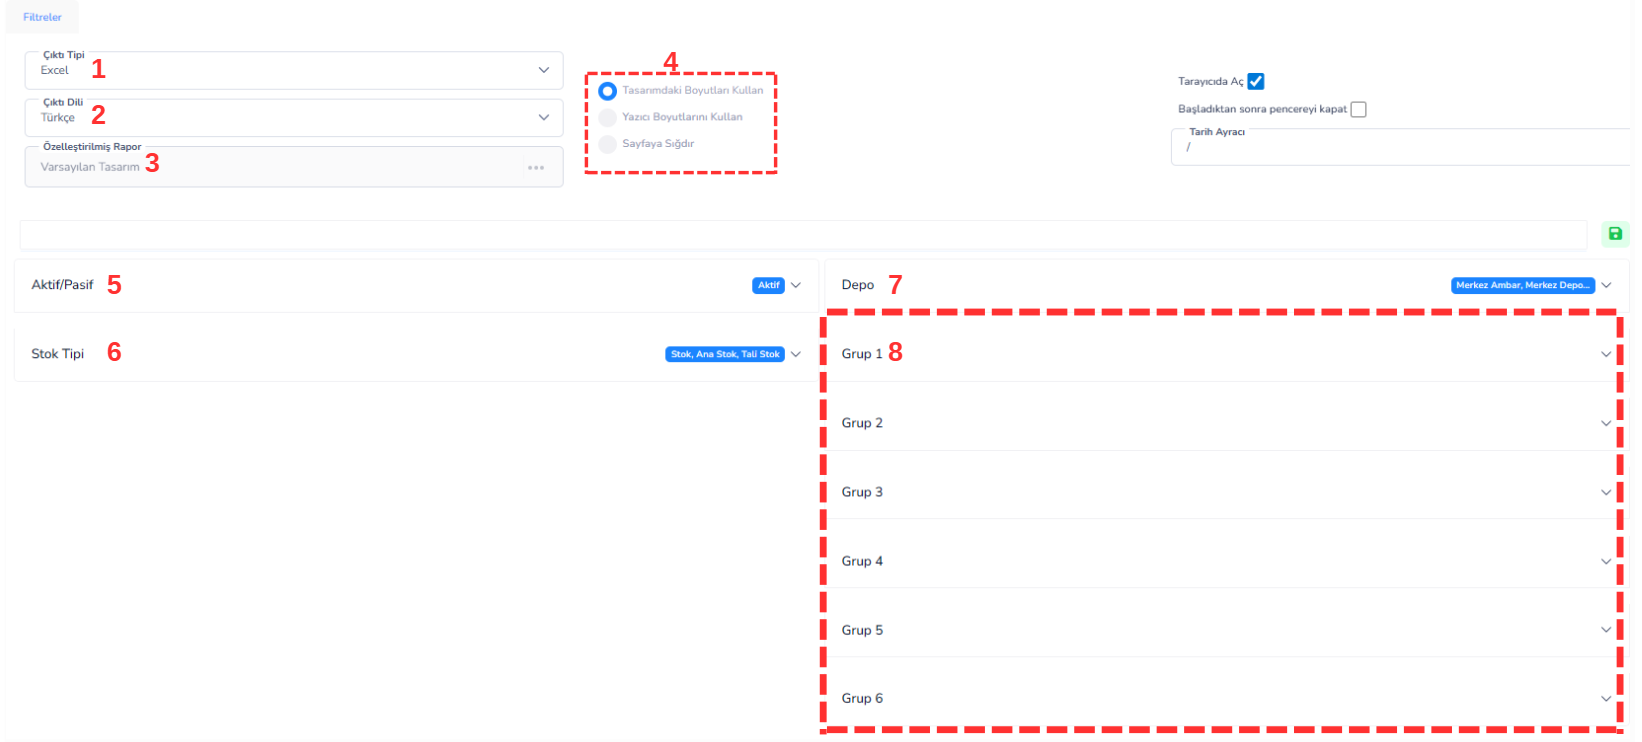
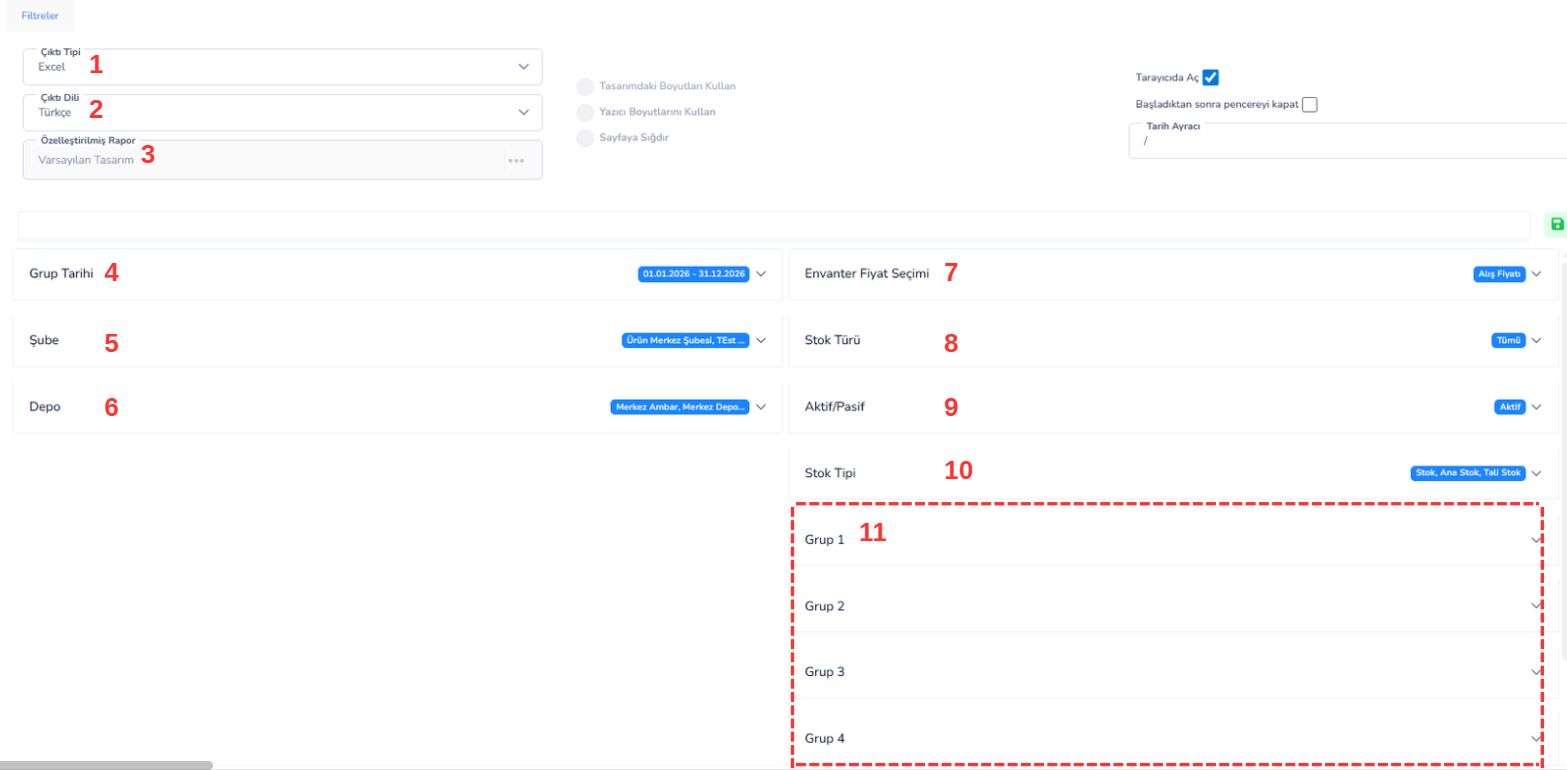
Fields:1. Output Type:Determines the format in which the report will be received. Example: Excel, PDF etc.
2. Output Language:You choose the language in which the report will be generated. Example: Turkish, English
3. Customized Report:Ready or custom designed report templates are selected here.
4. Use Dimensions in Design:The report is created according to the dimensions specified in the design.
5. Use Printer Dimensions:The report output is scaled according to the printer settings.
6. Fit to Page:The report is automatically adjusted to fit the page.
7. Open in Browser: Allows the report to be opened in the browser after it is created.
8. Close window after starting:This window closes automatically after the report extraction process starts.
9. Date Separator: Specifies the separator character to be used in the date format. Example: / or –
Filter Fields:
10. Group Date:Determines the date range according to which the report will be created.
11. Inventory Price Selection:Determines which price type the inventories will be reported according to. Example: Buying price, selling price
12. Branch:Determines which branch data the report will show.
13. Stock Type: Filtering is done according to the type of stocks.
14. Warehouse: Select which warehouse stocks will be included in the report.
15. Active/Passive:Filtering is done according to the active or passive status of the stocks.
16. Stock Type: Allows filtering of stocks according to their types such as main stock, sub-stock.
17. Special Codes (1-5): Allows filtering according to special codes assigned to stocks. It is used for company-specific classification.
18. Groups (1-4): Allows filtering according to the group information to which the stocks belong. It is used for category-based discrimination in reporting.
Intended Use
Seeing stock status within a specific date range
Conducting warehouse and branch based inventory analysis
Examining the financial value of stocks
Providing data in reporting and auditing processes
PRICE LIST REPORT
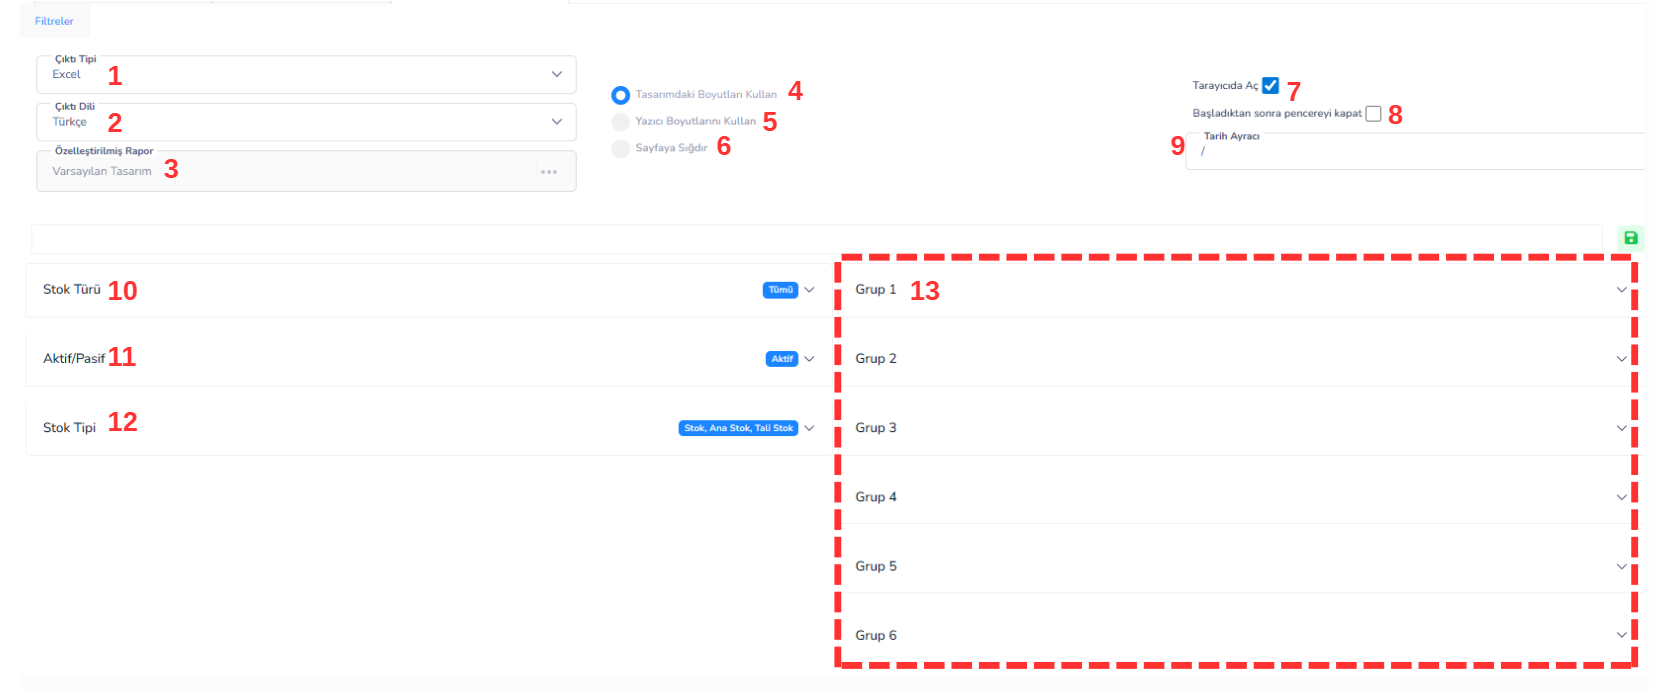
This report is used to collectively display and analyze price information for stocks or services defined in the system. Price lists can be reported and exported according to specified filters.
Fields:1. Output Type:Determines the format in which the report will be received. Example: Excel, PDF etc.
2. Output Language:You choose the language in which the report will be generated.
3. Customized Report:Allows you to choose ready-made or custom-built report designs.
4. Use Dimensions in DesignThe report is created according to the dimensions specified in the design.
5. Use Printer DimensionsThe report output is scaled according to the printer settings.
6. Fit to Page:The report automatically fits to the page.
7. Open in Browser:After the report is created, it opens in the browser.
8. Close the window after starting:The screen closes automatically after the report process starts.
9. DateSeparator: Specifies the separator character to be used in the date format.
Filter Fields:
10. Stock Type: Filtering is done according to the type of stocks to be reported. Example: Whole, finished product, semi-finished product, etc.
11. Active/Passive:Filtering is done according to the active or passive status of the stocks.
12. Stock Type: Filtering is done according to the structures of the stocks such as main stock and sub-stock.
13. Groups (1-6): Allows filtering according to the group information to which the stocks belong. It is used for detailed category-based reporting.
Bottom Buttons:
14. Print:Creates the price list report according to the selected filters.
15. Edit Columns: Allows to customize the fields (columns) to be shown in the report.
16. Close:Turns off the screen.
Intended Use
See all product/service prices collectively
Creating and sharing price lists
Make price comparisons
Provide up-to-date price control
Reporting by printing Excel/PDF
BELOW MINIMUM STOCK LIST REPORT
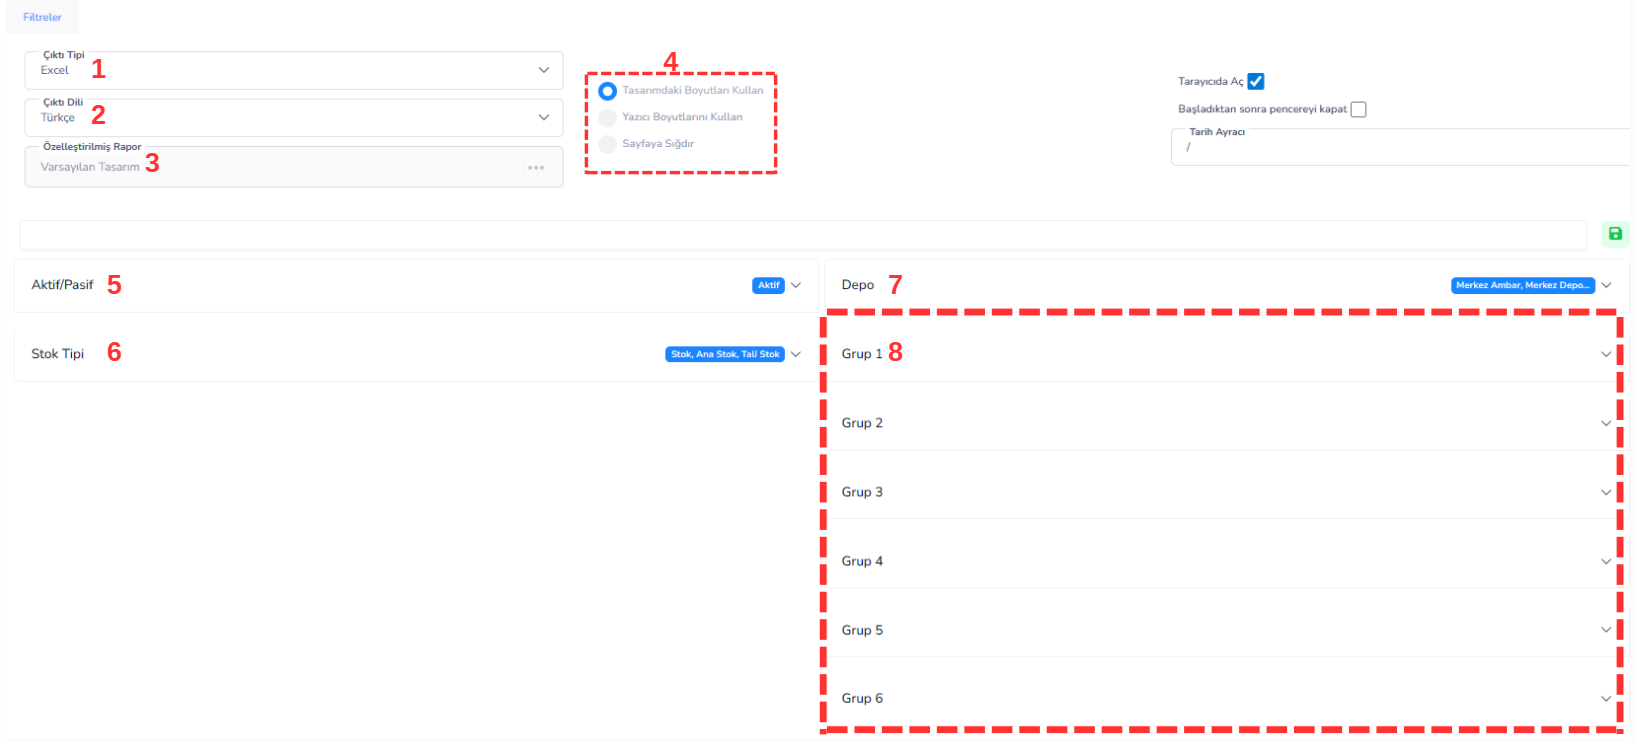
This report is used to detect stocks below the minimum stock level defined in stock cards. It allows you to quickly see stocks that have reached a critical level or are about to run out.
Fields:
1.Output Type: Determines the format in which the report will be received (Excel, PDF, etc.)
2.Output Language: Report language selection is made.
3.Customized Report: The report design to be used is selected.
4.Design Settings: Provides printing and page layout options.
Filter Fields:6.Active/Passive: Allows only active or passive stocks to be listed.
5.Stock Type: Filtering is done according to classification such as main stock, secondary stock.
7.Warehouse: It is selected in which warehouses below the minimum stocks will be displayed.
Grouping Fields:
8.(Group 1 – Group 6): Allows to analyze stocks by grouping them by category. (Ex: Brand, category, product group, etc.)
Intended Use
Identifying stocks that have fallen to critical levels
Prevent lost sales
Creating orders on time
Doing stock planning correctly
Analyzing warehouse-based deficiencies
STOCK LIST REPORT ABOVE MAXIMUM
This report is used to detect products that exceed the maximum stock level defined in stock cards. It enables the analysis of overstocked products.
Fields:
1.Output Type: Determines the format in which the report will be received (Excel, PDF, etc.)
2.Output Language: Report language selection is made.
3.Customized Report: The report design to be used is selected.
4.Design Settings: Includes printing and page layout options.
Filter Fields:
5.Active/Passive: Allows listing of active or passive stocks.
6.Stock Tracking / Stock Type: Filtering is done according to classification such as main stock, secondary stock.
7.Warehouse: Select which warehouses' excess stocks will be displayed.
Grouping Fields:
8.(Group 1 – Group 6): Enables grouping of stocks based on category. (Ex: product group, brand, category, etc.)
Intended Use
Detecting excess stock accumulation
Reduce warehouse costs
Increasing stock turnover
Avoid unnecessary purchases
Planning a campaign or discount
STOCK QUALIFICATIONS REPORT
This report is used to analyze whether current stock quantities meet the needs. Whether the stocks are sufficient, insufficient or excessive is evaluated through this report.
Fields:
1.Output Type: Determines the format in which the report will be received (Excel, PDF, etc.)
2.Output Language: The language in which the report will be created is selected.
3.Customized Report: The report design to be used is selected.
4.Design / Print Settings: Includes page layout and output options.
Filter Fields:5.Active/Passive: Enables active or passive stocks to be included in the report.
6.Stock Type: Filtering is done according to classifications such as main stock and secondary stock.
7.Warehouse: Select which warehouse stocks will be analyzed.
Grouping Fields:
8.(Group 1 – Group 6): Enables grouping of stocks based on category. (Ex: product group, brand, category, etc.)
Intended Use
Seeing whether stocks are sufficient
Planning for sales and production processes
Detecting missing or excess stocks
Optimizing the procurement process
Reducing the risk of overstock or stock shortfall
STOCK GROSS PROFITABILITY REPORT
This report is used to analyze the gross profit obtained from the difference between the buying and selling prices of stocks. Product-based profitability can be examined in detail.
General Settings:
1.Output Type: Determines the format in which the report will be received (Excel, PDF, etc.)
2.Output Language: Report language selection is made.
3.Customized Report: The report design to be used is selected.
Filter Fields:
Group 4 Date (Start – End): Determines the date range in which the profitability analysis will be carried out.
5th Branch: Filters the sales and cost data of a specific branch.
6.Warehouse: Enables warehouse-based profitability analysis.
7.Inventory Price Selection: Determines the price type to be used in cost calculation. (Usually the purchase price is used)
8.Stock Type: Determines which stocks will be included in the report.
9.Active/Passive: Filtering is done according to active or passive stocks.
10.Stock Type: Filtering is done according to classification such as main stock, secondary stock.
Grouping Fields:
11.(Group 1 – Group 6): Provides category-based profitability analysis of products. (Ex: brand, product group, category, etc.)
Intended Use
Seeing which product is more profitable
Identifying loss-making products
Creating a pricing strategy
Analyzing sales performance
Supporting campaign and discount decisions
✓
Bu doküman yardımcı oldu mu?
Eksik veya geliştirilmesi gereken bir bölüm varsa destek ekibimizle paylaşabilirsiniz.